


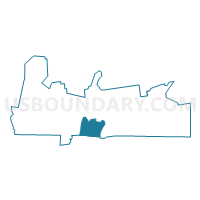
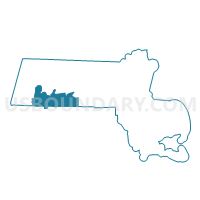
Agawam Town city, Hampden County, Massachusetts
About
Outline

Summary
| Unique Area Identifier | 134076 |
| Name | Agawam Town city |
| County | Hampden County |
| State | Massachusetts |
| Area (square miles) | 24.35 |
| Land Area (square miles) | 23.31 |
| Water Area (square miles) | 1.04 |
| % of Land Area | 95.72 |
| % of Water Area | 4.28 |
| Latitude of the Internal Point | 42.06473110 |
| Longtitude of the Internal Point | -72.65347740 |
| Total Population | 28,438 |
| Total Housing Units | 12,139 |
| Total Households | 11,664 |
| Median Age | 44.4 |
Maps
Graphs
Select a template below for downloading or customizing gragh for Agawam Town city, Hampden County, Massachusetts


Neighbors
Neighoring County Subdivision (by Name) Neighboring County Subdivision on the Map
- Longmeadow town, Hampden County, MA
- Southwick town, Hampden County, MA
- Springfield city, Hampden County, MA
- Suffield town, Hartford County, CT
- West Springfield Town city, Hampden County, MA
- Westfield city, Hampden County, MA
Top 10 Neighboring Place (by Population) Neighboring Place on the Map
- Springfield city, MA (153,060)
- Westfield city, MA (41,094)
- Agawam Town city, MA (28,438)
- West Springfield Town city, MA (28,391)
- Longmeadow CDP, MA (15,784)
Top 10 Neighboring Unified School District (by Population) Neighboring Unified School District on the Map
- Springfield School District, MA (153,060)
- Westfield School District, MA (41,094)
- Agawam School District, MA (28,438)
- West Springfield School District, MA (28,391)
- Longmeadow School District, MA (15,784)
- Suffield School District, CT (15,735)
- Southwick-Tolland School District, MA (9,987)
Top 10 Neighboring State Legislative District Lower Chamber (by Population) Neighboring State Legislative District Lower Chamber on the Map
- Second Hampden District, MA (42,757)
- Sixth Hampden District, MA (42,022)
- Third Hampden District, MA (41,281)
- Fourth Hampden District, MA (41,094)
- Tenth Hampden District, MA (37,829)
- State House District 61, CT (24,674)
Top 10 Neighboring State Legislative District Upper Chamber (by Population) Neighboring State Legislative District Upper Chamber on the Map
- First Hampden & Hampshire District, MA (158,884)
- Second Hampden & Hampshire District, MA (156,603)
- Hampden District, MA (155,199)
- State Senate District 7, CT (100,005)
Top 10 Neighboring 111th Congressional District (by Population) Neighboring 111th Congressional District on the Map
- Congressional District 2, CT (729,771)
- Congressional District 2, MA (661,045)
- Congressional District 1, MA (644,956)
Top 10 Neighboring Census Tract (by Population) Neighboring Census Tract on the Map
- Census Tract 4771.02, Hartford County, CT (8,521)
- Census Tract 8125, Hampden County, MA (7,665)
- Census Tract 8132.05, Hampden County, MA (7,481)
- Census Tract 8133.01, Hampden County, MA (7,343)
- Census Tract 8126, Hampden County, MA (6,799)
- Census Tract 8124.01, Hampden County, MA (6,210)
- Census Tract 8021, Hampden County, MA (6,075)
- Census Tract 8131.01, Hampden County, MA (5,888)
- Census Tract 8123, Hampden County, MA (5,861)
- Census Tract 8132.09, Hampden County, MA (5,646)
Top 10 Neighboring 5-Digit ZIP Code Tabulation Area (by Population) Neighboring 5-Digit ZIP Code Tabulation Area on the Map
- 01085, MA (41,117)
- 01089, MA (28,391)
- 01108, MA (26,688)
- 01001, MA (16,769)
- 01106, MA (16,021)
- 06078, CT (12,413)
- 01105, MA (12,350)
- 01030, MA (11,669)
- 01077, MA (9,502)
- 06093, CT (3,322)
Data
Demographic, Population, Households, and Housing Units
** Data sources from census 2010 **
Show Data on Map
Download Full List as CSV
Download Quick Sheet as CSV
| Subject | This Area | Hampden County | Massachusetts | National |
|---|---|---|---|---|
| POPULATION | ||||
| Total Population Map | 28,438 | 463,490 | 6,547,629 | 308,745,538 |
| POPULATION, HISPANIC OR LATINO ORIGIN | ||||
| Not Hispanic or Latino Map | 27,498 | 366,714 | 5,919,975 | 258,267,944 |
| Hispanic or Latino Map | 940 | 96,776 | 627,654 | 50,477,594 |
| POPULATION, RACE | ||||
| White alone Map | 26,899 | 354,580 | 5,265,236 | 223,553,265 |
| Black or African American alone Map | 426 | 41,644 | 434,398 | 38,929,319 |
| American Indian and Alaska Native alone Map | 45 | 1,871 | 18,850 | 2,932,248 |
| Asian alone Map | 502 | 9,118 | 349,768 | 14,674,252 |
| Native Hawaiian and Other Pacific Islander alone Map | 0 | 233 | 2,223 | 540,013 |
| Some Other Race alone Map | 212 | 42,763 | 305,151 | 19,107,368 |
| Two or More Races Map | 354 | 13,281 | 172,003 | 9,009,073 |
| POPULATION, SEX | ||||
| Male Map | 13,592 | 222,669 | 3,166,628 | 151,781,326 |
| Female Map | 14,846 | 240,821 | 3,381,001 | 156,964,212 |
| POPULATION, AGE (18 YEARS) | ||||
| 18 years and over Map | 22,678 | 353,605 | 5,128,706 | 234,564,071 |
| Under 18 years | 5,760 | 109,885 | 1,418,923 | 74,181,467 |
| POPULATION, AGE | ||||
| Under 5 years | 1,326 | 27,742 | 367,087 | 20,201,362 |
| 5 to 9 years | 1,481 | 29,235 | 385,687 | 20,348,657 |
| 10 to 14 years | 1,791 | 31,713 | 405,613 | 20,677,194 |
| 15 to 17 years | 1,162 | 21,195 | 260,536 | 12,954,254 |
| 18 and 19 years | 636 | 15,719 | 202,220 | 9,086,089 |
| 20 years | 317 | 7,701 | 101,248 | 4,519,129 |
| 21 years | 266 | 7,178 | 96,372 | 4,354,294 |
| 22 to 24 years | 855 | 18,306 | 278,048 | 12,712,576 |
| 25 to 29 years | 1,514 | 28,165 | 441,525 | 21,101,849 |
| 30 to 34 years | 1,404 | 25,986 | 403,616 | 19,962,099 |
| 35 to 39 years | 1,678 | 27,215 | 418,195 | 20,179,642 |
| 40 to 44 years | 2,037 | 31,204 | 468,954 | 20,890,964 |
| 45 to 49 years | 2,354 | 34,758 | 515,434 | 22,708,591 |
| 50 to 54 years | 2,404 | 34,837 | 497,001 | 22,298,125 |
| 55 to 59 years | 2,149 | 30,746 | 432,822 | 19,664,805 |
| 60 and 61 years | 810 | 10,831 | 156,594 | 7,113,727 |
| 62 to 64 years | 1,103 | 15,214 | 213,953 | 9,704,197 |
| 65 and 66 years | 610 | 8,002 | 114,758 | 5,319,902 |
| 67 to 69 years | 777 | 10,614 | 149,701 | 7,115,361 |
| 70 to 74 years | 938 | 13,406 | 192,001 | 9,278,166 |
| 75 to 79 years | 893 | 11,707 | 162,592 | 7,317,795 |
| 80 to 84 years | 813 | 10,339 | 138,473 | 5,743,327 |
| 85 years and over | 1,120 | 11,677 | 145,199 | 5,493,433 |
| MEDIAN AGE BY SEX | ||||
| Both sexes Map | 44.40 | 38.60 | 39.10 | 37.20 |
| Male Map | 42.30 | 36.80 | 37.70 | 35.80 |
| Female Map | 46.10 | 40.00 | 40.30 | 38.50 |
| HOUSEHOLDS | ||||
| Total Households Map | 11,664 | 179,927 | 2,547,075 | 116,716,292 |
| HOUSEHOLDS, HOUSEHOLD TYPE | ||||
| Family households: Map | 7,455 | 115,961 | 1,603,591 | 77,538,296 |
| Husband-wife family Map | 5,761 | 75,335 | 1,178,690 | 56,510,377 |
| Other family: Map | 1,694 | 40,626 | 424,901 | 21,027,919 |
| Male householder, no wife present Map | 487 | 9,054 | 106,657 | 5,777,570 |
| Female householder, no husband present Map | 1,207 | 31,572 | 318,244 | 15,250,349 |
| Nonfamily households: Map | 4,209 | 63,966 | 943,484 | 39,177,996 |
| Householder living alone Map | 3,503 | 52,612 | 732,263 | 31,204,909 |
| Householder not living alone Map | 706 | 11,354 | 211,221 | 7,973,087 |
| HOUSEHOLDS, HISPANIC OR LATINO ORIGIN OF HOUSEHOLDER | ||||
| Not Hispanic or Latino householder: Map | 11,394 | 149,831 | 2,363,312 | 103,254,926 |
| Hispanic or Latino householder: Map | 270 | 30,096 | 183,763 | 13,461,366 |
| HOUSEHOLDS, RACE OF HOUSEHOLDER | ||||
| Householder who is White alone | 11,175 | 144,392 | 2,141,886 | 89,754,352 |
| Householder who is Black or African American alone | 160 | 14,896 | 150,977 | 14,129,983 |
| Householder who is American Indian and Alaska Native alone | 17 | 684 | 6,454 | 939,707 |
| Householder who is Asian alone | 146 | 2,563 | 109,022 | 4,632,164 |
| Householder who is Native Hawaiian and Other Pacific Islander alone | 0 | 70 | 684 | 143,932 |
| Householder who is Some Other Race alone | 63 | 13,865 | 93,230 | 4,916,427 |
| Householder who is Two or More Races | 103 | 3,457 | 44,822 | 2,199,727 |
| HOUSEHOLDS, HOUSEHOLD TYPE BY HOUSEHOLD SIZE | ||||
| Family households: Map | 7,455 | 115,961 | 1,603,591 | 77,538,296 |
| 2-person household Map | 3,311 | 46,337 | 646,935 | 31,882,616 |
| 3-person household Map | 1,781 | 29,036 | 389,107 | 17,765,829 |
| 4-person household Map | 1,535 | 23,409 | 342,062 | 15,214,075 |
| 5-person household Map | 539 | 10,665 | 147,354 | 7,411,997 |
| 6-person household Map | 179 | 3,967 | 50,366 | 3,026,278 |
| 7-or-more-person household Map | 110 | 2,547 | 27,767 | 2,237,501 |
| Nonfamily households: Map | 4,209 | 63,966 | 943,484 | 39,177,996 |
| 1-person household Map | 3,503 | 52,612 | 732,263 | 31,204,909 |
| 2-person household Map | 620 | 9,577 | 166,231 | 6,360,012 |
| 3-person household Map | 62 | 1,159 | 28,109 | 992,156 |
| 4-person household Map | 21 | 427 | 11,614 | 411,171 |
| 5-person household Map | 2 | 122 | 3,488 | 126,634 |
| 6-person household Map | 1 | 40 | 1,043 | 48,421 |
| 7-or-more-person household Map | 0 | 29 | 736 | 34,693 |
| HOUSING UNITS | ||||
| Total Housing Units Map | 12,139 | 192,175 | 2,808,254 | 131,704,730 |
| HOUSING UNITS, OCCUPANCY STATUS | ||||
| Occupied Map | 11,664 | 179,927 | 2,547,075 | 116,716,292 |
| Vacant Map | 475 | 12,248 | 261,179 | 14,988,438 |
| HOUSING UNITS, OCCUPIED, TENURE | ||||
| Owned with a mortgage or a loan Map | 6,191 | 79,104 | 1,177,473 | 52,979,430 |
| Owned free and clear Map | 2,466 | 32,615 | 409,685 | 23,006,644 |
| Renter occupied Map | 3,007 | 68,208 | 959,917 | 40,730,218 |
| HOUSING UNITS, VACANT, VACANCY STATUS | ||||
| For rent Map | 227 | 4,393 | 66,673 | 4,137,567 |
| Rented, not occupied Map | 7 | 210 | 3,822 | 206,825 |
| For sale only Map | 74 | 1,717 | 25,038 | 1,896,796 |
| Sold, not occupied Map | 17 | 390 | 6,408 | 421,032 |
| For seasonal, recreational, or occasional use Map | 49 | 1,795 | 115,630 | 4,649,298 |
| For migrant workers Map | 1 | 5 | 161 | 24,161 |
| Other vacant Map | 100 | 3,738 | 43,447 | 3,652,759 |
| HOUSING UNITS, OCCUPIED, AVERAGE HOUSEHOLD SIZE BY TENURE | ||||
| Total: Map | 2.38 | 2.49 | 2.48 | 2.58 |
| Owner occupied Map | 2.56 | 2.59 | 2.66 | 2.65 |
| Renter occupied Map | 1.87 | 2.34 | 2.18 | 2.44 |
| HOUSING UNITS, OCCUPIED, TENURE BY RACE OF HOUSEHOLDER | ||||
| Owner occupied: Map | 8,657 | 111,719 | 1,587,158 | 75,986,074 |
| Householder who is White alone Map | 8,422 | 100,053 | 1,443,462 | 63,446,275 |
| Householder who is Black or African American alone Map | 68 | 5,975 | 50,643 | 6,261,464 |
| Householder who is American Indian and Alaska Native alone Map | 9 | 219 | 2,233 | 509,588 |
| Householder who is Asian alone Map | 84 | 1,429 | 54,010 | 2,688,861 |
| Householder who is Native Hawaiian and Other Pacific Islander alone Map | 0 | 26 | 248 | 61,911 |
| Householder who is Some Other Race alone Map | 16 | 2,744 | 20,485 | 1,975,817 |
| Householder who is Two or More Races Map | 58 | 1,273 | 16,077 | 1,042,158 |
| Renter occupied: Map | 3,007 | 68,208 | 959,917 | 40,730,218 |
| Householder who is White alone Map | 2,753 | 44,339 | 698,424 | 26,308,077 |
| Householder who is Black or African American alone Map | 92 | 8,921 | 100,334 | 7,868,519 |
| Householder who is American Indian and Alaska Native alone Map | 8 | 465 | 4,221 | 430,119 |
| Householder who is Asian alone Map | 62 | 1,134 | 55,012 | 1,943,303 |
| Householder who is Native Hawaiian and Other Pacific Islander alone Map | 0 | 44 | 436 | 82,021 |
| Householder who is Some Other Race alone Map | 47 | 11,121 | 72,745 | 2,940,610 |
| Householder who is Two or More Races Map | 45 | 2,184 | 28,745 | 1,157,569 |
| HOUSING UNITS, OCCUPIED, TENURE BY HISPANIC OR LATINO ORIGIN OF HOUSEHOLDER | ||||
| Owner occupied: Map | 8,657 | 111,719 | 1,587,158 | 75,986,074 |
| Not Hispanic or Latino householder Map | 8,549 | 104,723 | 1,541,505 | 69,617,625 |
| Hispanic or Latino householder Map | 108 | 6,996 | 45,653 | 6,368,449 |
| Renter occupied: Map | 3,007 | 68,208 | 959,917 | 40,730,218 |
| Not Hispanic or Latino householder Map | 2,845 | 45,108 | 821,807 | 33,637,301 |
| Hispanic or Latino householder Map | 162 | 23,100 | 138,110 | 7,092,917 |
| HOUSING UNITS, OCCUPIED, TENURE BY HOUSEHOLD SIZE | ||||
| Owner occupied: Map | 8,657 | 111,719 | 1,587,158 | 75,986,074 |
| 1-person household Map | 1,940 | 25,374 | 337,783 | 16,453,569 |
| 2-person household Map | 3,153 | 39,451 | 547,166 | 27,618,605 |
| 3-person household Map | 1,497 | 19,530 | 276,048 | 12,517,563 |
| 4-person household Map | 1,350 | 16,568 | 261,809 | 10,998,793 |
| 5-person household Map | 466 | 6,992 | 110,229 | 5,057,765 |
| 6-person household Map | 153 | 2,419 | 36,086 | 1,965,796 |
| 7-or-more-person household Map | 98 | 1,385 | 18,037 | 1,373,983 |
| Renter occupied: Map | 3,007 | 68,208 | 959,917 | 40,730,218 |
| 1-person household Map | 1,563 | 27,238 | 394,480 | 14,751,340 |
| 2-person household Map | 778 | 16,463 | 266,000 | 10,624,023 |
| 3-person household Map | 346 | 10,665 | 141,168 | 6,240,422 |
| 4-person household Map | 206 | 7,268 | 91,867 | 4,626,453 |
| 5-person household Map | 75 | 3,795 | 40,613 | 2,480,866 |
| 6-person household Map | 27 | 1,588 | 15,323 | 1,108,903 |
| 7-or-more-person household Map | 12 | 1,191 | 10,466 | 898,211 |
Loading...